Twenty ways to measure AI impact in HR.
Most HR teams measure AI the way the vendor demo measures it: hours saved, tickets deflected, a cost line that bends down. That proves value to exactly one audience and leaves the other three unconvinced. This is the scorecard for all four, organised by who is looking.
Free to share. The one-pager is the at-a-glance view; the guards edition adds each metric's formula and the loophole that gets it gamed, for working sessions where you are actually picking metrics.
“A metric is a behaviour contract. Whatever you measure, someone optimises toward it literally, so the test for any KPI is: what is the laziest way to make this number go up, and is that the behaviour you wanted?”
The single-lens problem.
When a function deploys AI, the instinct is to measure the thing that is easiest to count. In HR that is almost always operating cost: hours saved, tickets deflected, a headcount line that holds flat while volume grows. It is a real number and it is worth having. It is also the answer to only one question, asked by only one audience.
Four audiences are actually watching, and they are not watching the same number. The function watches its own cost and quality. The practitioners inside HR watch whether their job got more valuable or merely faster. The workforce watches whether asking HR for something got easier. And the business leadership watches whether HR became a sharper partner, which is a number HR mostly cannot self-report. An AI program can win the first lens and lose the other three, and most do, because the first lens is the only one anyone instrumented.
The second principle is sharper than the first, and it is where most scorecards quietly incentivise the wrong work.
A metric is a behaviour contract. Whatever you choose to measure, someone will optimise toward it literally, so the only honest test for a KPI is to ask: what is the laziest way to make this number go up, and is that the behaviour I wanted? Most HR AI metrics fail that test. Measure share of process steps automated, and a team maximises it by bolting AI onto every existing step, including the ones that should not exist. The metric punishes the better move, which is deleting steps. So the scorecard measures reimagination, not automation: a process that goes from twelve steps to three should score higher than one that automates all twelve badly.
The same logic runs through every metric below. Self-service resolution is gamed by marking a query resolved when the user gave up. Adoption is gamed by mandating logins. Speed-to-hire is gamed by lowering the bar. Each metric on the scorecard ships with the guard that closes its loophole, because a KPI without its guard is just a target waiting to be hit the wrong way.
The fourth lens is where most HR scorecards lose the room. They measure the leadership view as a perception survey: do leaders rate HR highly, can they name a win. That measures whether HR did PR, not whether it moved anything. The altitude that earns the function lasting stature is different: HR's AI has to move a constraint the CEO already names out loud. Not cost-per-ticket, which no leader feels, but the revenue a people bottleneck is gating, the scarce talent that feeds every product line, the velocity that scale taxes away, the cost base the CFO has to reengineer. Measure the leadership lens in the business's own numbers, claim only the verified share, and the function stops asking for recognition and starts removing the company's constraints.
Four lenses. One function.
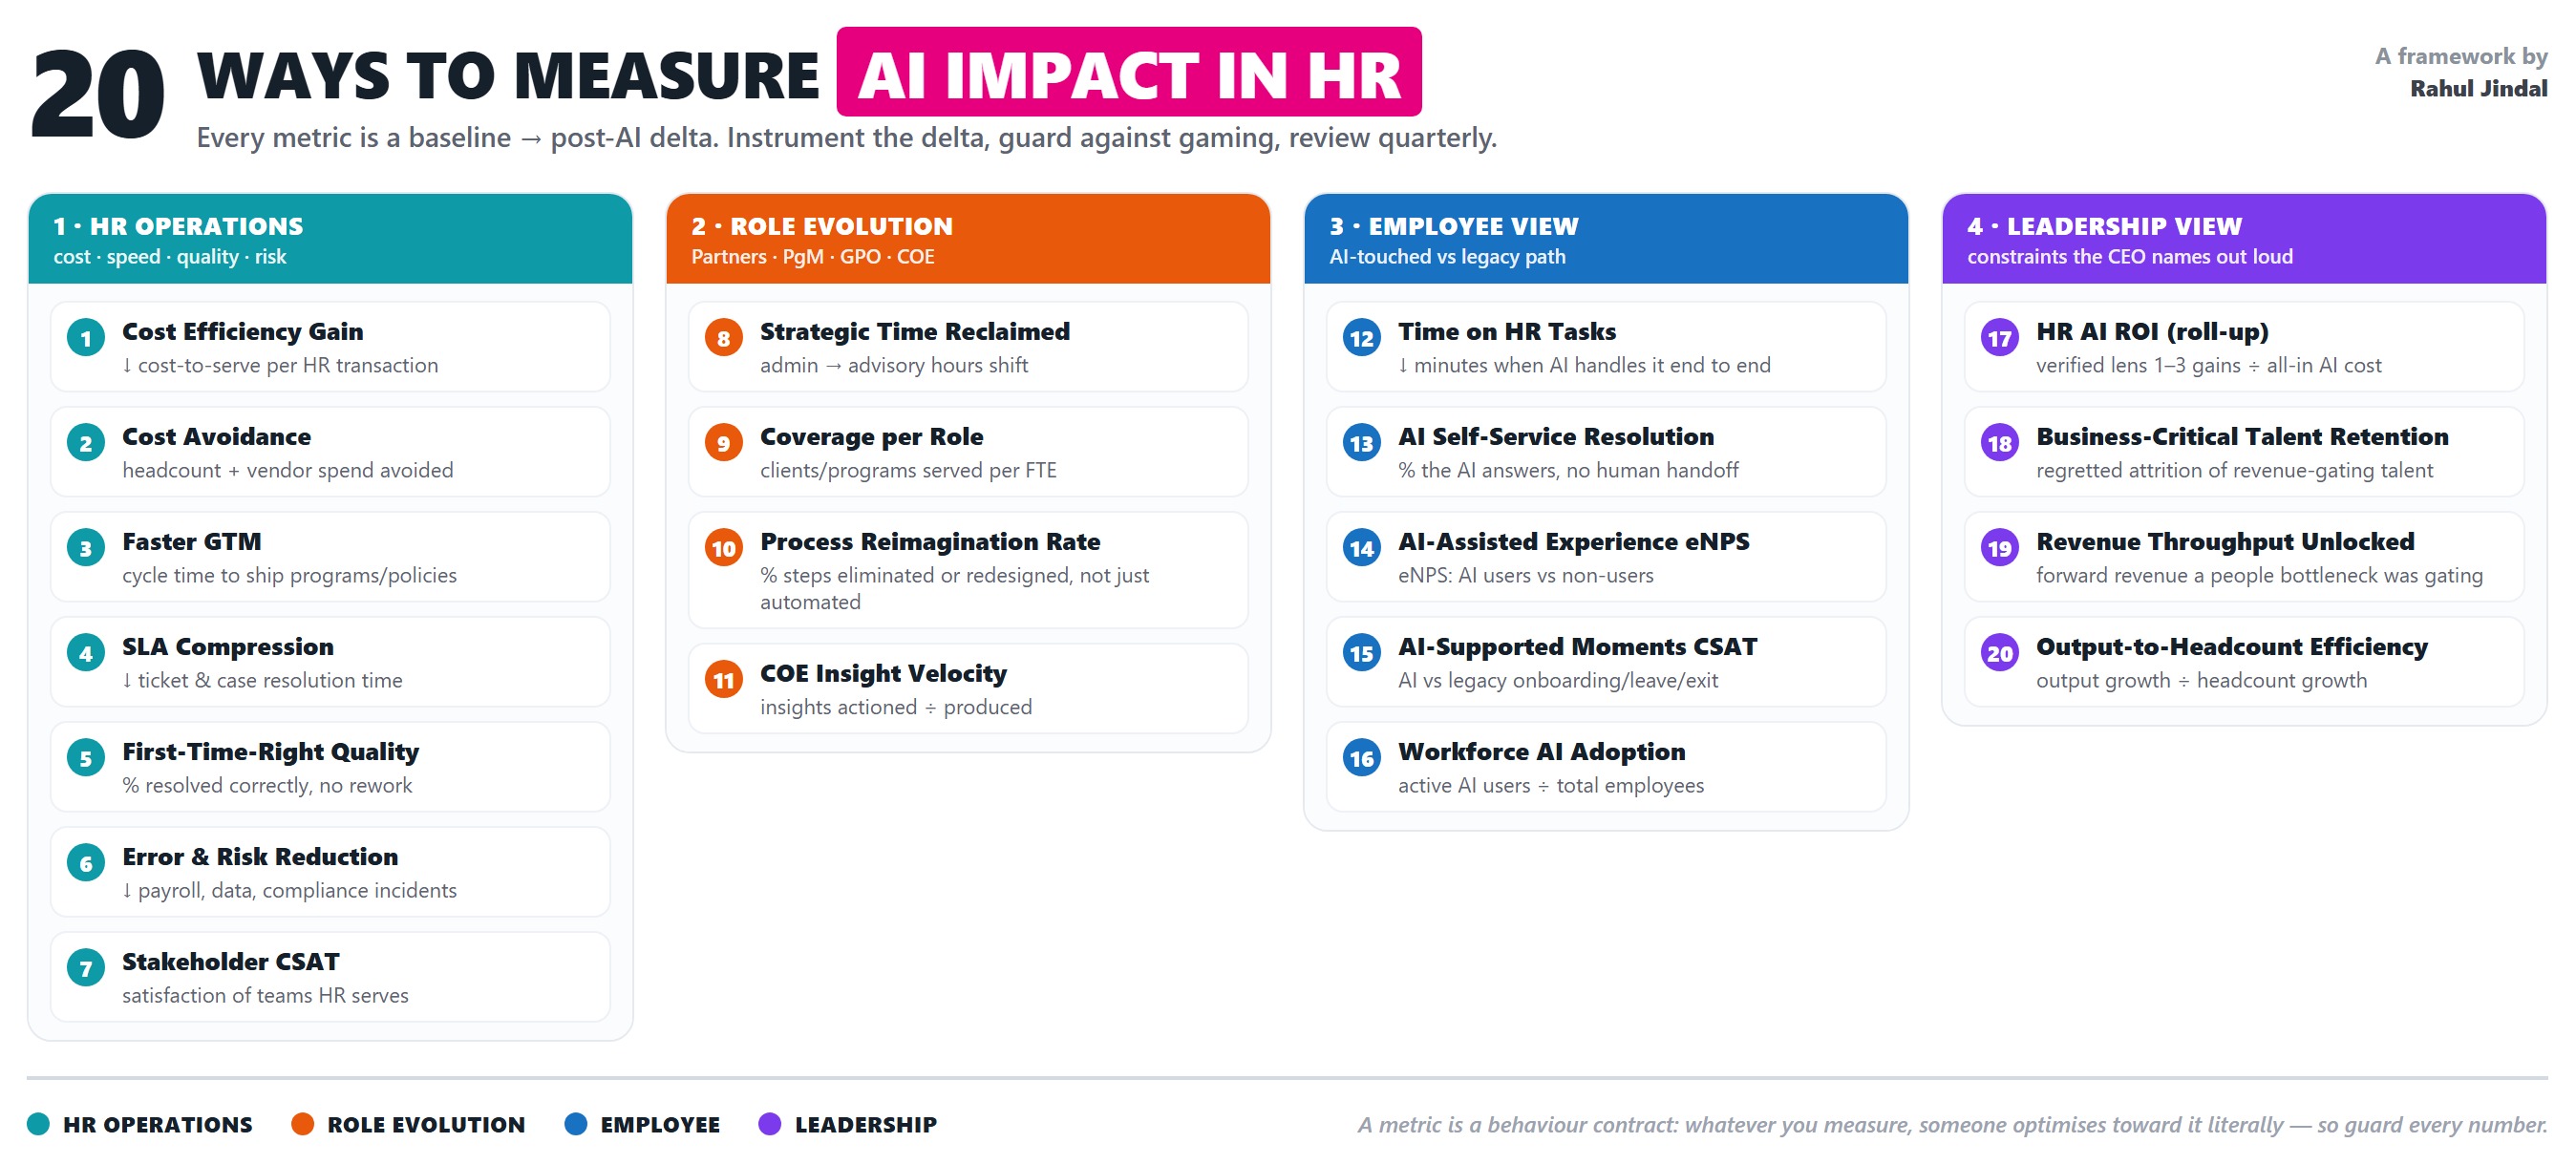
Each lens is a different audience asking a different question about the same AI program. The scorecard is balanced when all four are instrumented. When only one is, you are measuring AI the way the demo did.
HR Operations
The function, measured on itself
Does the work get delivered cheaper, faster, and with fewer errors?
Role Evolution
People Partners · PgMs · GPOs · COEs
Do the people inside HR do higher-value work, or just the same work faster?
Employee Experience
The workforce HR serves
Does the average employee feel HR got easier? Read AI-touched journeys against the legacy path, so the number is the AI's doing, not the org's mood.
Leadership & Business
The CEO and the CHRO's C-suite peers: CFO, division heads
Does HR's AI move a constraint the CEO already names out loud: revenue throughput, scarce talent, velocity, the cost base? Measured in the business's numbers, not HR's.
Where the lenses disagree is where the truth is.
Run all four lenses. The diagnostic is not any single score, it is the pattern across them. The most common patterns each name a specific failure the cost line alone would have hidden.
HR's cost-to-serve fell, but employee time-on-task rose. You did not eliminate the work, you pushed it onto the workforce and booked the saving. The honest scorecard nets these against each other.
The machine got more efficient but the people inside it do the same work, just quicker. Strategic time reclaimed and reimagination rate are both near zero. This is automation without role evolution, and it caps out fast.
The first three lenses are green but no business-level number moved: not retention of the scarce talent, not the efficiency ratio, not the revenue a bottleneck was gating. Either the gains are not reaching the business, or HR is still reporting them in HR terms instead of the constraints the CEO names. Both are fixable, and both are invisible without this lens.
Every lens improved and none of the gains came from gaming the metric. That is the only pattern that survives a second look, and the only one worth taking to a board.
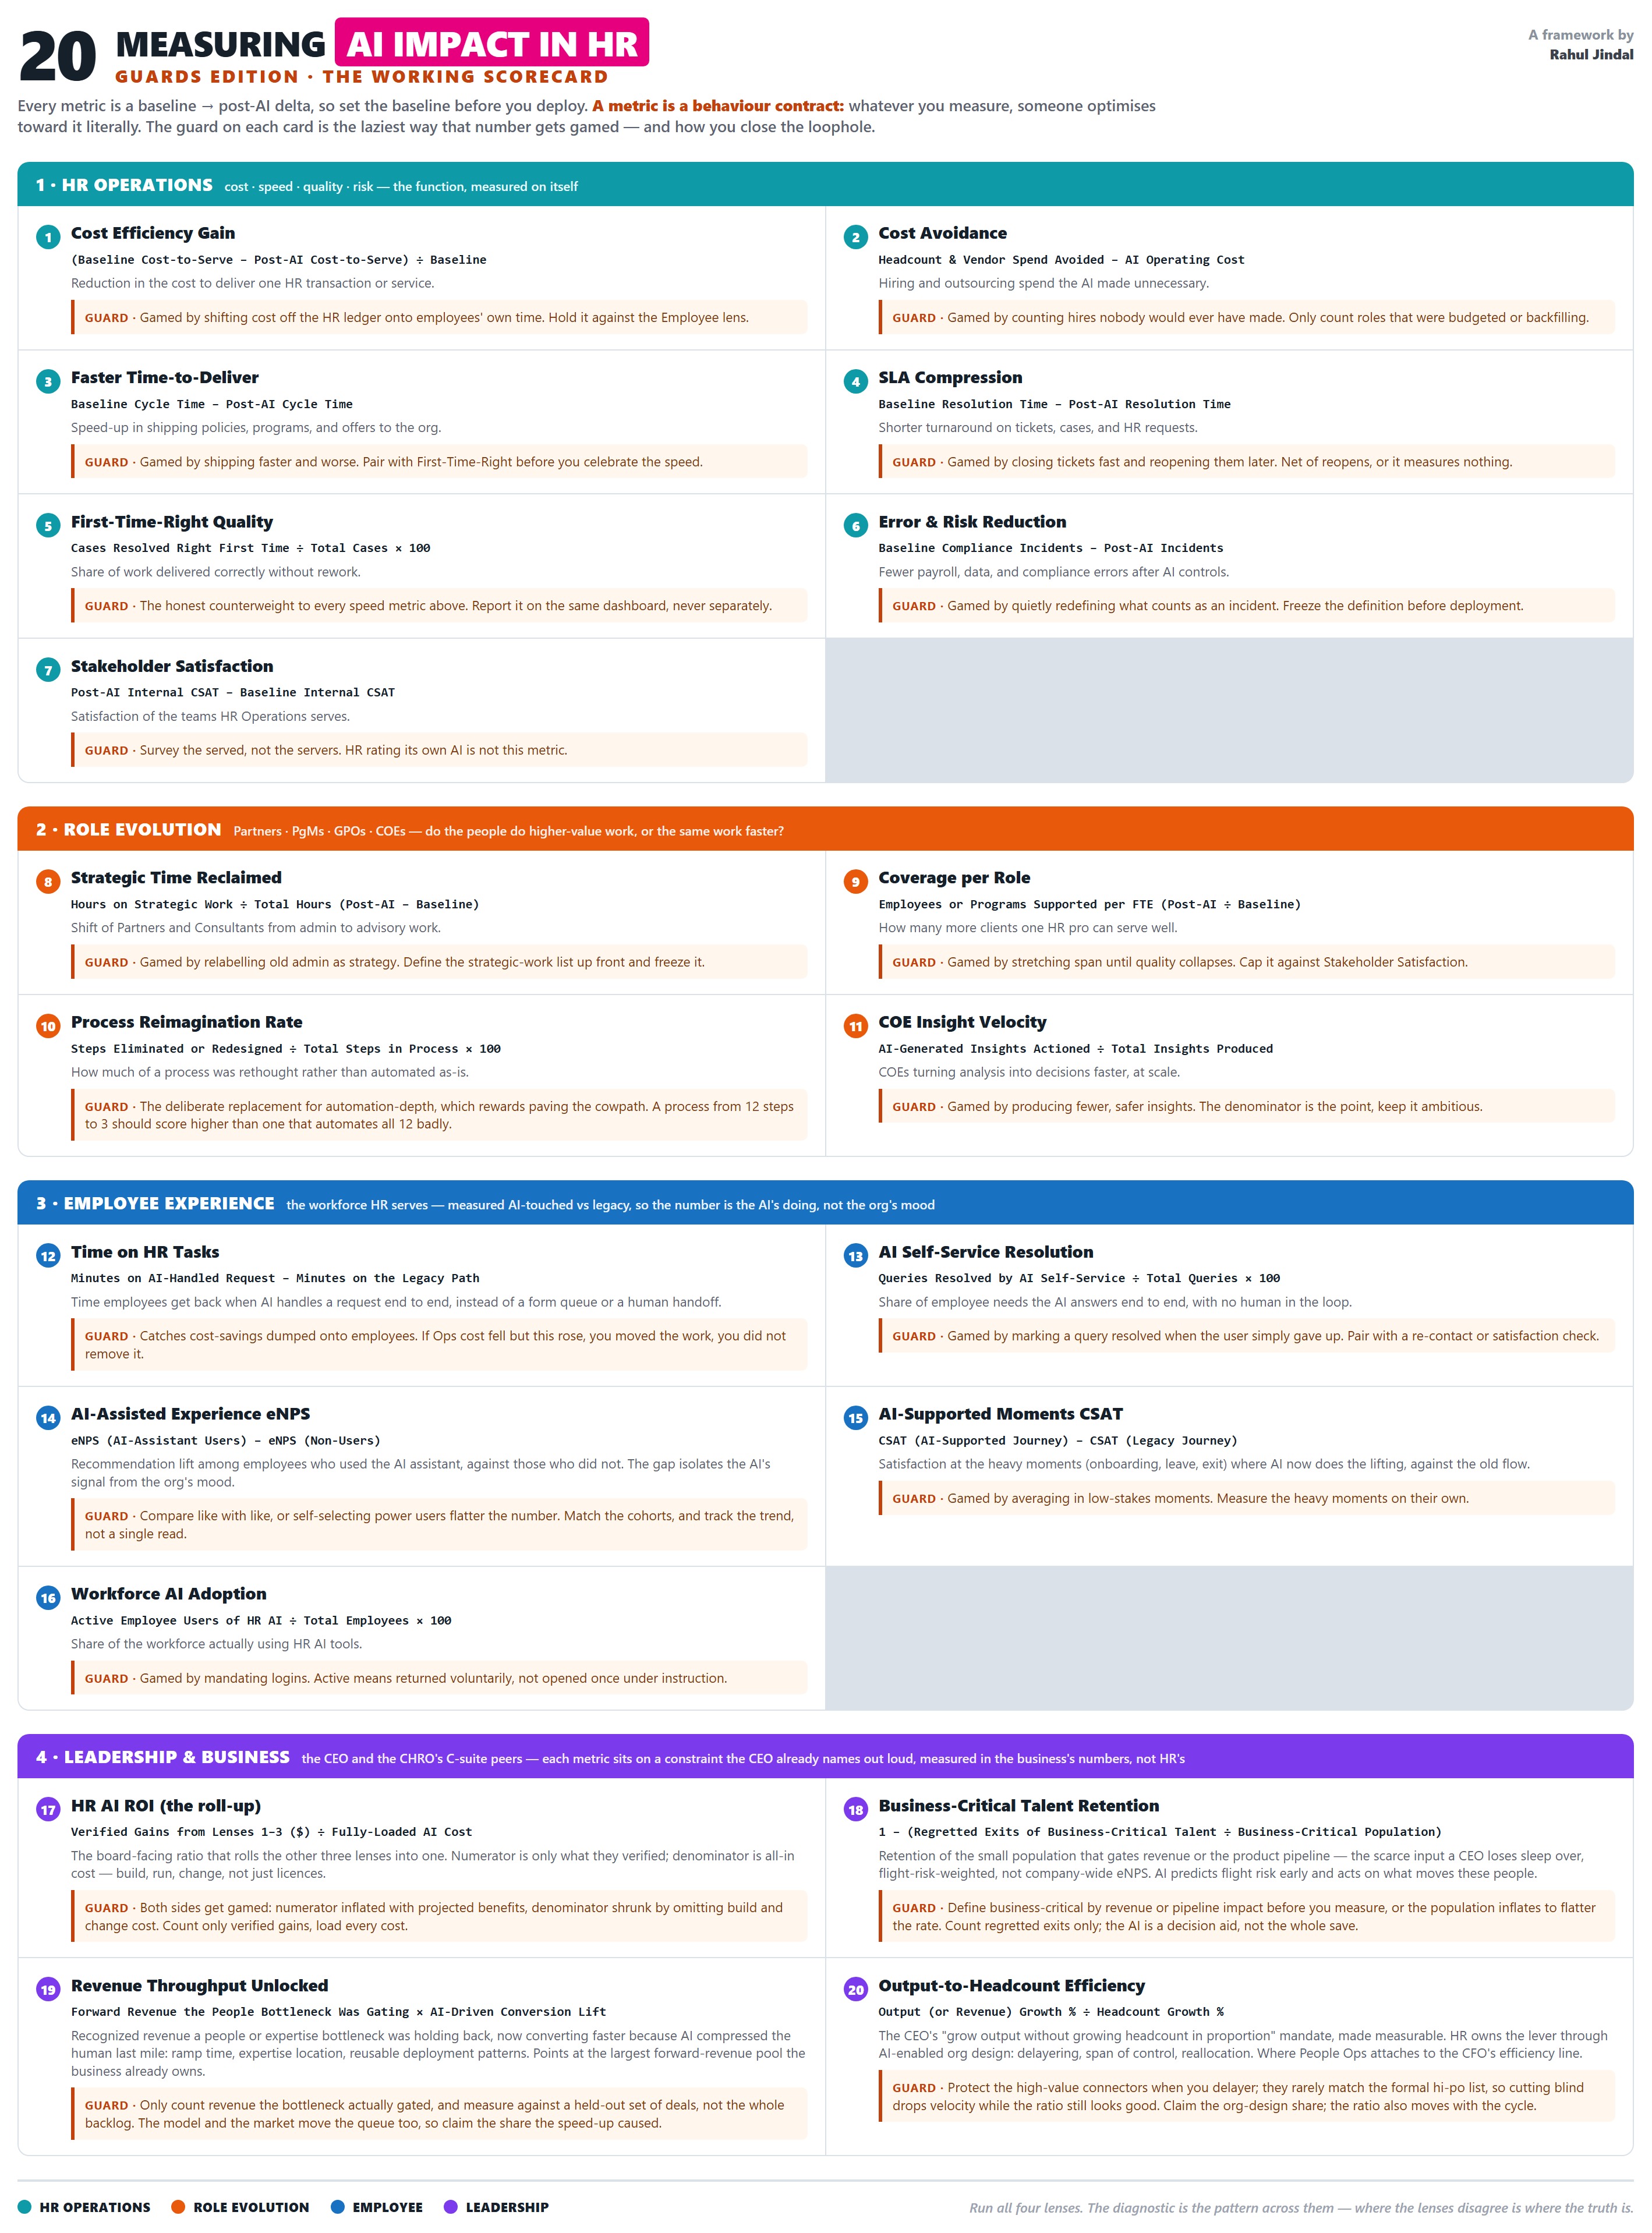
Twenty metrics. Each with its guard.
Every metric is a baseline-to-post-AI delta, so set the baseline before you deploy or the number is unknowable. The guard on each card is the laziest way that metric gets gamed, and how you close the loophole.
HR Operations
The function, measured on itselfCost Efficiency Gain
Reduction in the cost to deliver one HR transaction or service.
Guard · Gamed by shifting cost off the HR ledger onto employees' own time. Hold it against the Employee lens.
Cost Avoidance
Hiring and outsourcing spend the AI made unnecessary.
Guard · Gamed by counting hires nobody would ever have made. Only count roles that were budgeted or backfilling.
Faster Time-to-Deliver
Speed-up in shipping policies, programs, and offers to the org.
Guard · Gamed by shipping faster and worse. Pair with First-Time-Right before you celebrate the speed.
SLA Compression
Shorter turnaround on tickets, cases, and HR requests.
Guard · Gamed by closing tickets fast and reopening them later. Net of reopens, or it measures nothing.
First-Time-Right Quality
Share of work delivered correctly without rework.
Guard · The honest counterweight to every speed metric above. Report it on the same dashboard, never separately.
Error & Risk Reduction
Fewer payroll, data, and compliance errors after AI controls.
Guard · Gamed by quietly redefining what counts as an incident. Freeze the definition before deployment.
Stakeholder Satisfaction
Satisfaction of the teams HR Operations serves.
Guard · Survey the served, not the servers. HR rating its own AI is not this metric.
Role Evolution
People Partners · PgMs · GPOs · COEsStrategic Time Reclaimed
Shift of Partners and Consultants from admin to advisory work.
Guard · Gamed by relabelling old admin as strategy. Define the strategic-work list up front and freeze it.
Coverage per Role
How many more clients one HR pro can serve well.
Guard · Gamed by stretching span until quality collapses. Cap it against Stakeholder Satisfaction.
Process Reimagination Rate
How much of a process was rethought rather than automated as-is.
Guard · The deliberate replacement for automation-depth, which rewards paving the cowpath. A process that goes from 12 steps to 3 should score higher than one that automates all 12.
COE Insight Velocity
COEs turning analysis into decisions faster, at scale.
Guard · Gamed by producing fewer, safer insights. The denominator is the point, keep it ambitious.
Employee Experience
The workforce HR servesTime on HR Tasks
Time employees get back when AI handles a request end to end, instead of a form queue or a human handoff.
Guard · The metric that catches cost-savings dumped onto employees. If Ops cost fell but this rose, you moved the work, you did not remove it.
AI Self-Service Resolution
Share of employee needs the AI answers end to end, with no human in the loop.
Guard · Gamed by marking a query resolved when the user simply gave up. Pair with a re-contact or satisfaction check.
AI-Assisted Experience eNPS
Recommendation lift among employees who used the AI assistant, against those who did not. The gap isolates the AI's signal from the org's general mood.
Guard · Compare like with like, or self-selecting power users flatter the number. Match the cohorts, and track the trend, not a single read.
AI-Supported Moments CSAT
Satisfaction at the heavy moments (onboarding, leave, exit) where AI now does the lifting, measured against the old flow.
Guard · Gamed by averaging in low-stakes moments. Measure the heavy moments on their own.
Workforce AI Adoption
Share of the workforce actually using HR AI tools.
Guard · Gamed by mandating logins. Active means returned voluntarily, not opened once under instruction.
Leadership & Business
The CEO and the CHRO's C-suite peers: CFO, division headsHR AI ROI (the roll-up)
The single board-facing ratio that rolls the other three lenses into one number. Numerator is only what those lenses verified; denominator is all-in cost: licences, build, run, and change.
Guard · Both sides get gamed: the numerator inflated with projected benefits, the denominator shrunk by omitting build and change cost. Count only verified gains, and load every cost.
Business-Critical Talent Retention
Retention of the small population that gates revenue or the product pipeline, the scarce input a CEO loses sleep over, flight-risk-weighted, not company-wide eNPS. AI's role is predicting flight risk early and acting on what actually moves these people.
Guard · Define business-critical by revenue or pipeline impact before you measure, or the population inflates to flatter the rate. Count regretted exits only, and treat the AI as a decision aid, not the whole save.
Revenue Throughput Unlocked
Recognized revenue that a people or expertise bottleneck was holding back, now converting faster because AI compressed the human last mile: ramp time, expertise location, reusable deployment patterns. Points straight at the largest forward-revenue pool the business already owns.
Guard · Only count revenue the bottleneck actually gated, and measure against a held-out set of deals, not the whole backlog. The model and the market move the queue too, so claim the share the deployment speed-up caused.
Output-to-Headcount Efficiency
The CEO's mandate to grow output without growing headcount in proportion, made measurable. HR owns the lever through AI-enabled org design (delayering, span of control, reallocation), so this is where People Ops attaches to the efficiency line the CFO reports.
Guard · Protect the high-value connectors when you delayer; network analysis finds them and they rarely match the formal hi-po list, so cutting blind drops velocity while the ratio still looks good. Claim the org-design share; the ratio also moves with the cycle.
Email this as a LinkedIn pack
Get a feed-ready LinkedIn post (under the 3,000-character cap), a long-form LinkedIn article version, the hero image, and an editable document version of the full essay, delivered to your inbox. Ready to post.
Measure it in the business's terms, not HR's.
Instrument all four lenses for the honest read. But if you can only socialise one upward, socialise the one that sits on a constraint the CEO already names out loud: the revenue a bottleneck was gating, the scarce talent that feeds every product, the velocity that scale taxes away.